3 Facts About Arizonans’ Health Care Access and Satisfaction

With new data finding mental health distress, heart disease, and other conditions on the rise in our state, compared to 2023, it’s likely that improving health outcomes is top of mind for Arizonans.
When a renewed focus on building a healthier future for Arizona is needed, the Arizona Health and Well-Being Progress Meter is a great place to start making informed decisions. The easy-to-access dashboard compiles key metrics like healthcare spending, health determinants like obesity and physical activity, and outcomes such as heart disease and diabetes.
Health and Well-Being is one of Arizona’s seven Shared Public Values, and this data allows Arizonans to see where we’re making strides and where there’s room for improvement. This is a valuable resource for driving conversations and decisions that can lead to better care, access, and overall health for all Arizonans.
Let’s take a look at a few trends in Arizona’s healthcare access and satisfaction that can provide a starting point for these much-needed conversations.
1. Arizonans are less likely to have a primary care provider than Americans on average.
Access to primary care providers (PCP) is tracked within the Health and Well-Being Progress Meter. You can see this data broken down by demographics like age, education, and income.
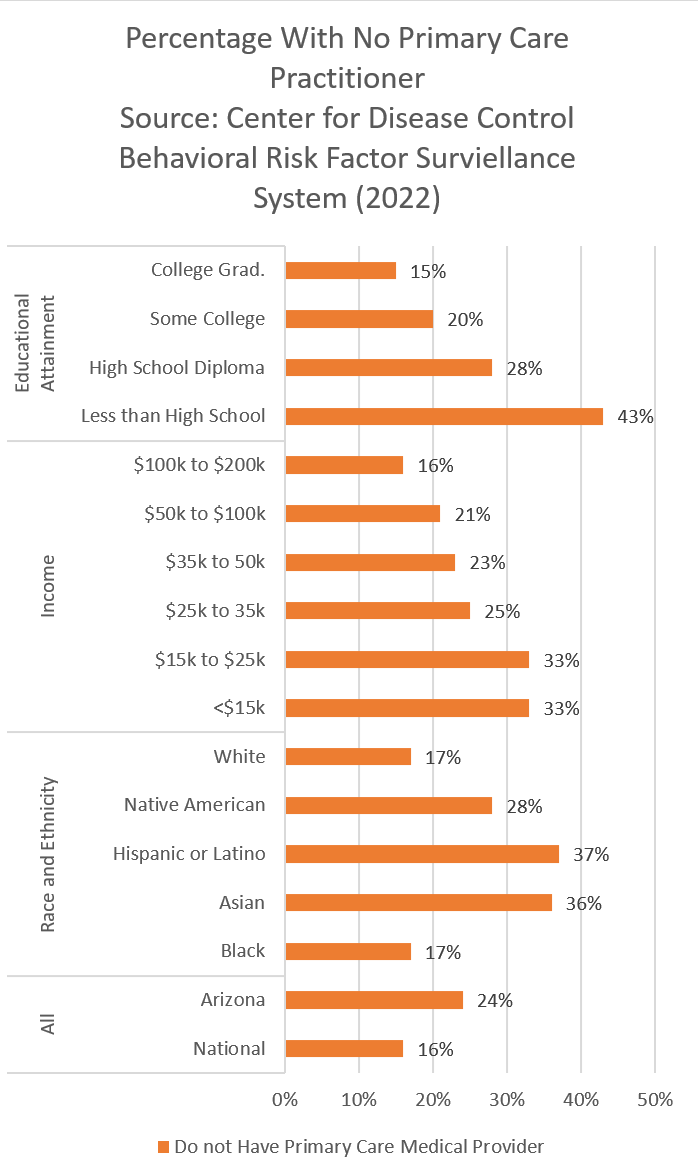
Currently, 24% of Arizonans don’t have a PCP, while only 16% of Americans don’t.
|
|
||
|
|
 |
|
| Figure 1: Arizonans are less likely to have a PCP if they have less than a high school degree, make less than $15,000, or are Hispanic or Latino. | ||
|
|
||
On average, people who have access to and regularly consult a PCP report better health outcomes due to early detection of serious illness, preventative care, and chronic disease management.
Among the reasons Arizonans may not have a PCP include cost, distance to a provider, shortage of professionals, and travel time to appointments.
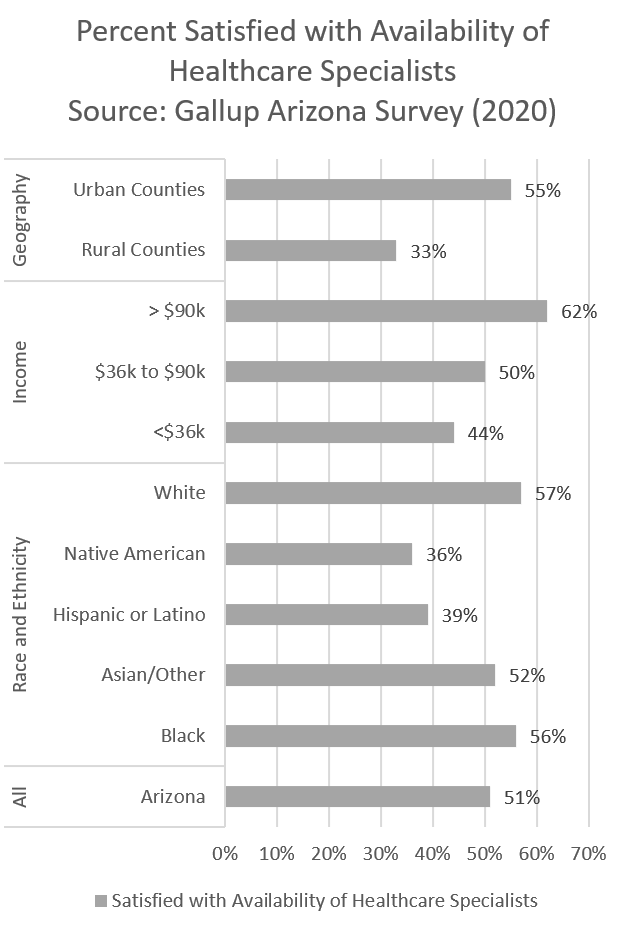
According to CFA’s Gallup Arizona Survey, only 52% of Arizonans are satisfied with the availability of healthcare specialists in their community.
As with many health metrics, access to preventive medicine varies significantly by demographic. These disparity trends in Arizona are similar if not more than national healthcare disparity metrics.
Within the race/ethnicity breakdown of PCP access, Asian and Hispanic Arizonans are twice as likely not to have a PCP than White and Black Arizonans.
Lack of access to primary care providers may only be exacerbated by projected shortfalls. The National Center for Health Workforce Analysis’s data says that by 2035, Arizona will have just 55% of the primary care providers needed.
2. Arizonans are less likely to have health insurance than Americans on average.
|
|
||
|
|
 |
|
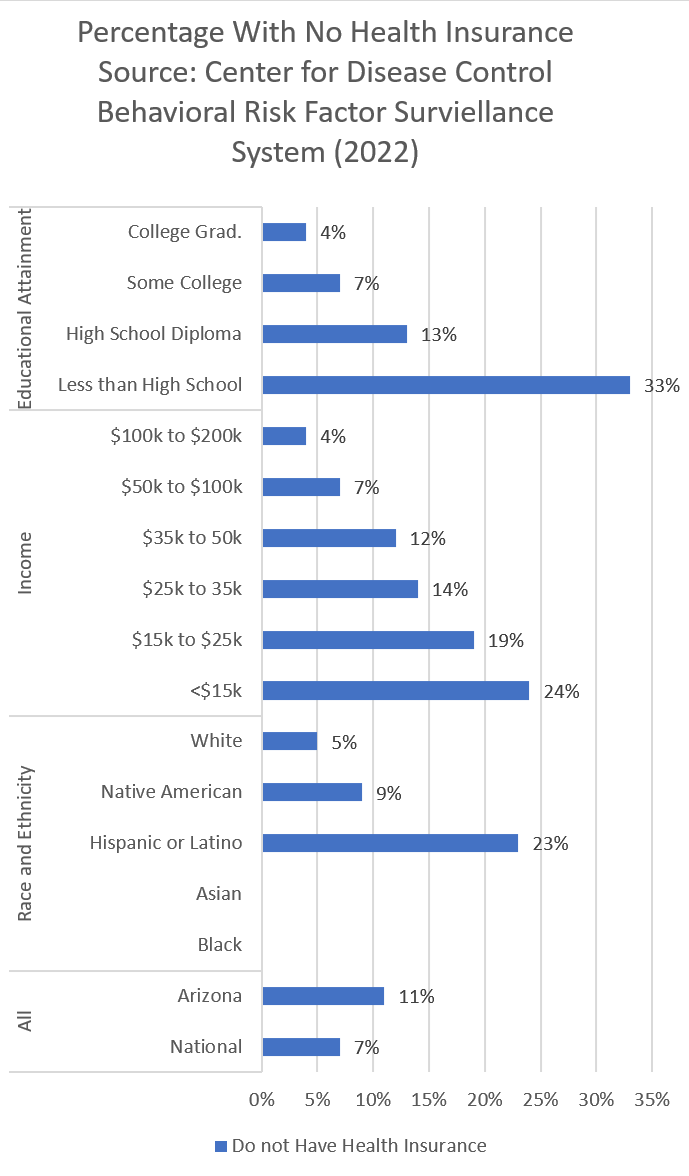
| Figure 2: Rates of those with no health insurance are much higher for those with lower educational attainment and who are of lower income. Due to survey limitations, data are not available for Black and Asian Arizonans for the 2022 dataset. | ||
|
|
||
A key contributor to the near quarter of Arizonans who don’t have a PCP is a lack of health insurance, which can help offset upfront costs.
Per the Arizona Health and Well-Being Progress Meter, about 11% of Arizonans do not have health insurance, which is slightly more than the U.S. at 7% according to the CDC.
Almost 90% of Arizonans agree that action is needed to guarantee affordable healthcare and insurance for Arizonans with preexisting health conditions according to the Gallup Arizona Survey. When asked what action was needed to improve Arizona’s Health and Well-Being, this recommended action for insurance coverage received the most support out of all the statements provided.
Demographic disparities exist for health insurance access as well.
It’s worth noting that as Arizonans attain more education, they are more likely to have health insurance.
More than a third of Arizonans with less than a high school diploma do not have health insurance whereas only 4% of Arizonans who have a college degree or technical training don’t have health insurance.
3. Differences in healthcare satisfaction mostly mirror access disparities.
|
|
||
|
|
   |
|
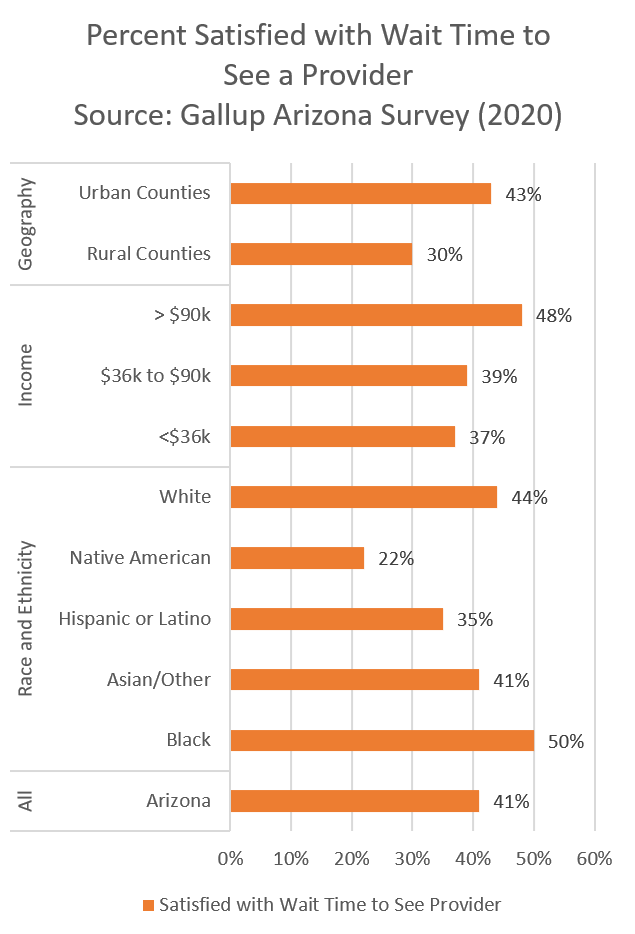
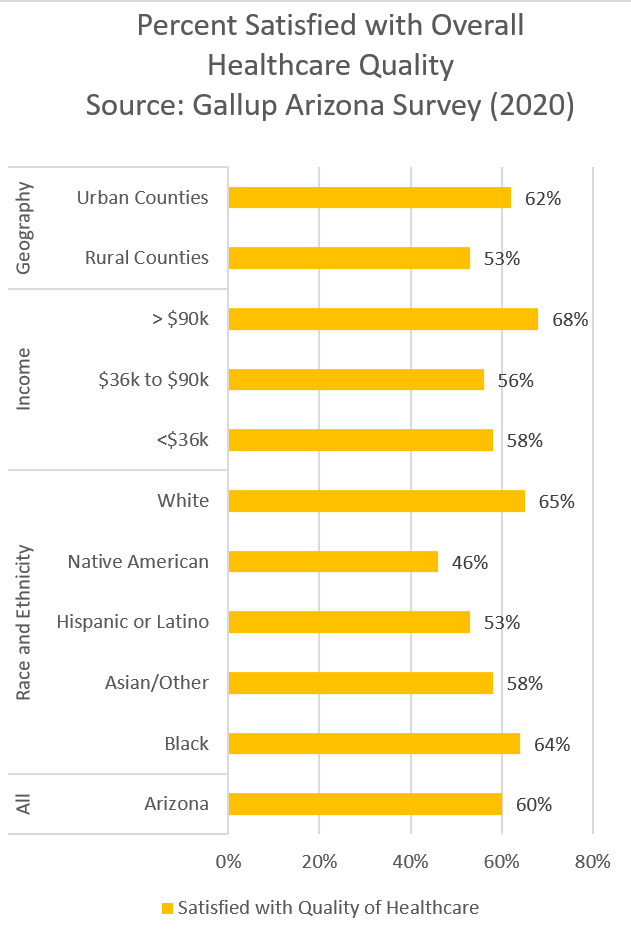
| Figures 3-5: Satisfaction in healthcare access and quality varies significantly across dimensions including race and ethnicity, income, and geography. | ||
|
|
||
Satisfaction with healthcare access and quality can be a useful measure for decision-makers to identify challenges within the healthcare delivery system that when addressed may result in a better experience and encourage more Arizonans to seek preventive care and improve outcomes.
The Gallup Arizona Survey measured Arizona’s satisfaction including:
- Wait time to see a medical provider
- Availability of healthcare specialists
- Overall quality of healthcare
Hispanic Arizonans, who are more likely among their peers to not have health insurance nor a PCP, are less satisfied with their healthcare quality overall than Black and White Arizonans.
Native Americans are more likely to have health insurance and a primary care provider, but report the least satisfaction with their health care quality. Only 1 in 5 Native Americans in Arizona are satisfied with wait time to see provider, about 1 in 3 is satisfied with availability of specialists in their community, and 1 in 2 is satisfied with overall healthcare quality.
Arizonans who make less than $15,000, who also are more likely not to have health insurance nor a primary care provider, are also more likely than Arizonans who make more money to be dissatisfied with their health care quality.
Moving Arizona Forward
A healthier Arizona not only improves quality of life but has positive impacts on economic conditions including improved workforce participation and reduced consumer healthcare expenses.
Education and economic opportunity are interconnected to Arizonans’ health and well-being. Elements of a Health Community from Vitalyst Health Foundation shows how every aspect of life ultimately impacts a person’s health.
Our most recent Arizona Voters’ Agenda findings indicate that healthcare is still a spending priority. More than 80% of likely voters opposed cutting Healthcare to balance the state budget.
The data calls leaders to action to examine the disparities and dissatisfaction and find collaborative solutions.
The Arizona Health and Well-Being Progress Meter, which includes even more metrics than those cited today, is a resource for all Arizonans to support awareness and decision-making that can improve the health of our communities.
About Our Data Sources
As with all the Arizona Progress Meters, data are publicly available from a trusted and regularly updated source. Data used in the health and well-being metrics come from the Center for Disease Control, Kaiser Family Foundation, Arizona Department of Health Services, the Gallup Organization, among others.
About Arizona Progress Meters
CFA developed the Arizona Progress Meters as a tool for policymakers, business leaders, civic leaders, educators, and others across the state to understand how Arizona is doing in areas critical to achieving The Arizona We Want. Eight Arizona Progress Meters provide valuable and regularly updated data on 80+ metrics in education, jobs, healthcare, environment, civic engagement, infrastructure, and more to support policymakers and other leaders’ data-driven dialogue, decision-making, and action. Learn more and leverage all the Arizona Progress Meters today.
